New USDA Plant Hardiness Zone Map
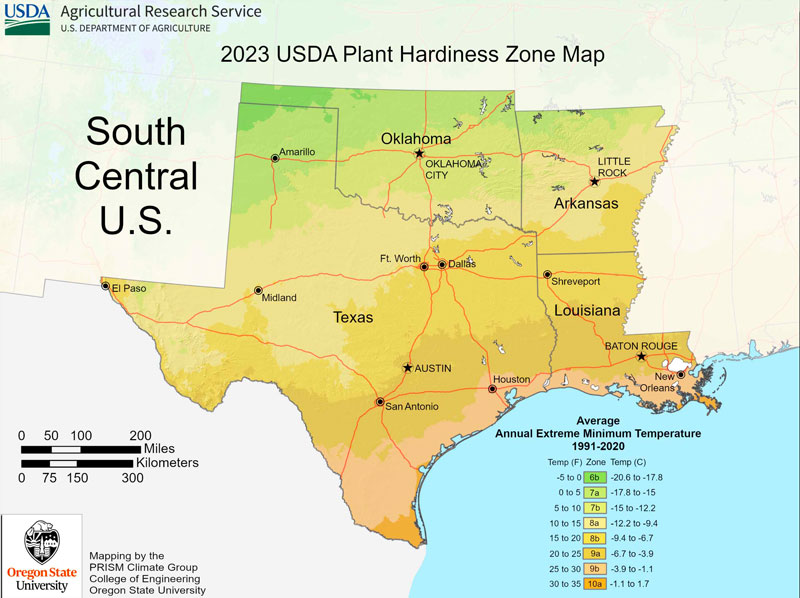
The United States Department of Agriculture has been tabulating and releasing a map of the lowest temperature that might be expected county-by-county across the entire United States. It’s an extremely detailed undertaking, but it’s some of the most useful data plant people can have.
The map is replotted every 15-30 years. That gives them the chance to bring aboard improved technology and to take into consideration any climatic changes that might have been happening during that time.
Note, however, that these maps deal only with the lowest temperatures expected each winter.
The easiest way to read the map is to find your county. Hopefully you’ve been living where you are long enough to have become familiar with winter temperatures. See if you agree with what the map is showing for what you can expect to see coming.
Our family has lived in rural Collin County (northeast of Dallas), and notable temperature events for us have been:
• The last two weeks of 1983 into early 1984 where we had 292 consecutive hours below freezing. Never bitterly cold, just never above freezing for even a minute during that time.
• December 23, 1989, when temperatures dropped to -4F. (Zone 6B)
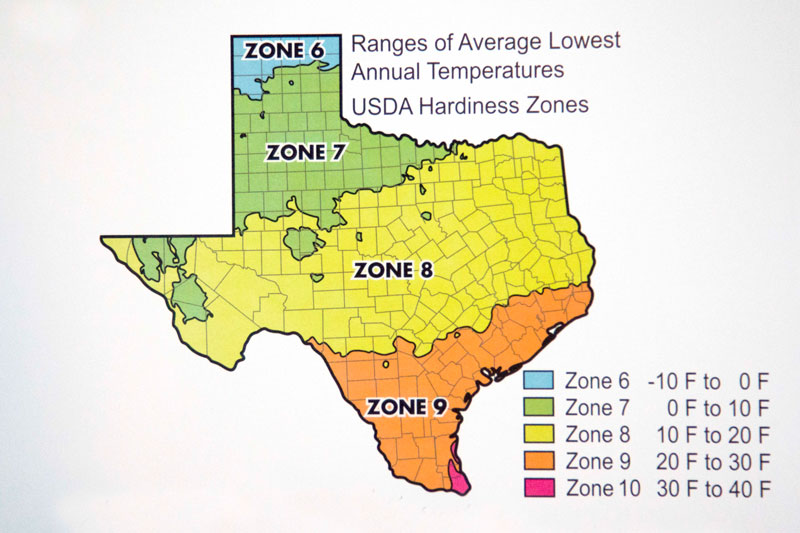
• A string of many winters that were warmer than normal during the early part of this century. Those temperature figures skewed the averages enough that it all threw most parts of Texas into what would seem to be warmer Hardiness Zones.
• Late February, 2021, when we had 4 inches of snow and temperatures dropped to -4F. (Zone 6B)
• Christmas 2022 when temperatures dropped into single digits for our first real cold spell of the winter.
Here’s where the wheels come off for me…
I look at either the 2012 or the new 2023 USDA Hardiness Zone maps, and I really don’t believe that either accurately warns me of temperatures I might expect.
Perhaps it’s just operator errors, but the 2023 map seems to have several bugs that frustrate me further.
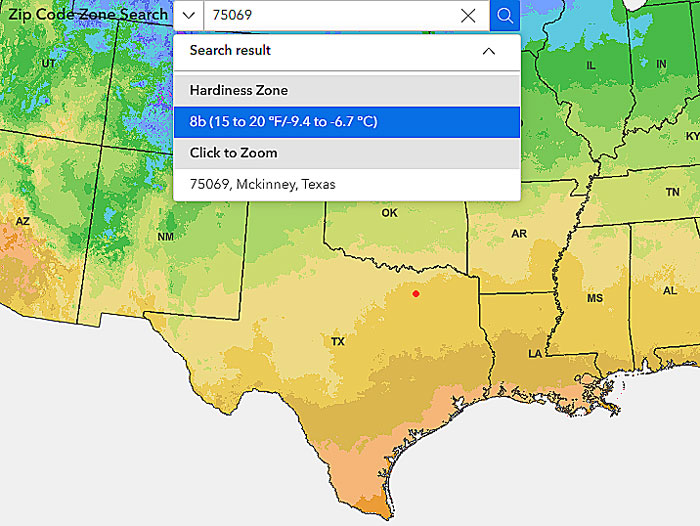
This link will show you the new map of the entire United States. Most gardeners would want to see that. However, if you are looking at this on a cell phone, you are probably going to have to turn your device to landscape view (horizontally) to get the map to open. In theory, you can click your cursor on your county, and it will tell you your Hardiness Zone (by their estimation). When I clicked on the northeast side of Dallas County (we live in Collin County), it reported that I am in Zone 8B. It said that I should expect temperatures in that Zone to fall to 15-20F. Which I say, “That ain’t right!” It gets much colder than that in DFW frequently (except for within the urban heat pockets near the city centers).
Know your area’s predicted Hardiness Zone, then buy plants listed for one Zone colder. If the map shows you to live in Zone 8, buy plants shown on their labels to be hardy to Zone 7 and colder. That could be the margin of error that saves you hundreds or thousands of replanting dollars.
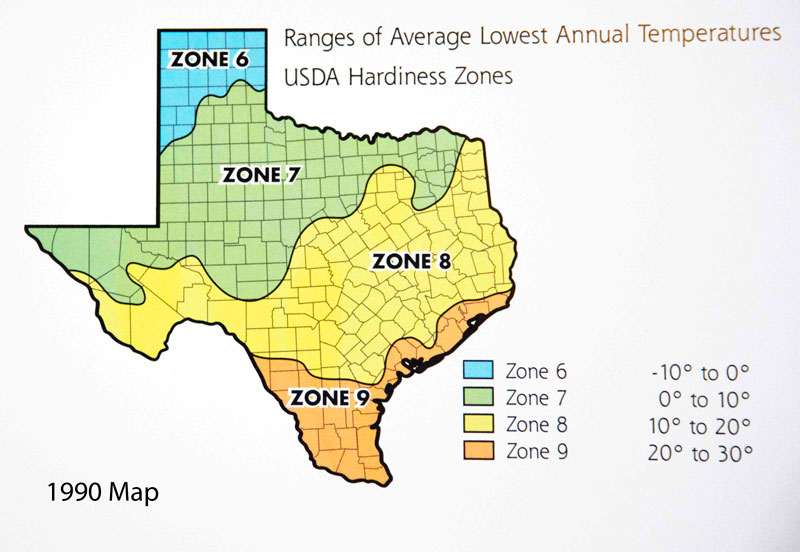
Note: Maps from 1992 and 2012 are adaptations from the USDA maps of those years as depicted in Neil Sperry’s Lone Star Gardening.
Summary of all this…
I still say that the 1990 Plant Hardiness Zone Map is the most practical map for gardeners to use. That’s why I continue to include it in stories like this, and it’s why I included it in my Lone Star Gardening book (available only from my website or office). If you stick with its estimate of hardiness for your county, you’ll have the best chance of succeeding.
You read e-gardens for facts, and I’ve just presented something that did express my own observations and feelings. But I’ll put my 53 years of experience helping the gardeners of Texas behind them. I’ll close as one of my radio heroes, Alex Burton, always finished his editorial remarks. I’m Neil Sperry, and the opinions are my own.