Check the New Map, Please
Almost 100 years ago Harvard University started classifying plants by where they might be expected to survive “average” winters. The term “Hardiness Zones” came into gardeners’ vocabulary.
As time went on, the U.S. Department of Agriculture and the United States National Arboretum got involved, and they started factoring in thousands of reporting stations from all over the country.
What you’re going to read from this point on is my conjecture. I seem to disagree with their facts, but I hope you’ll weigh in yourself before you invest in more woody plants in the future.
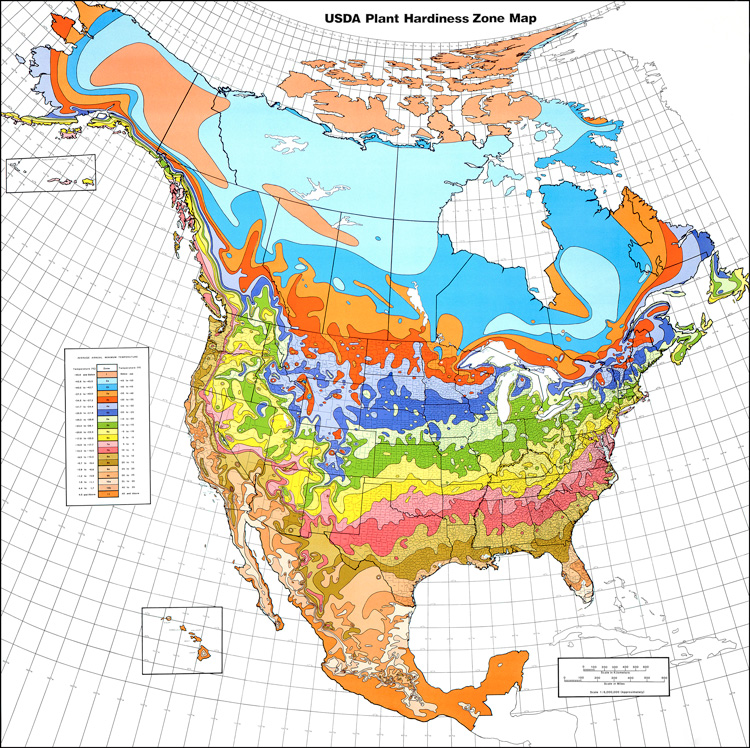
• A map was released in 1990 that I still feel was the most accurate as far as predicted low temperatures for the various parts of Texas were concerned.
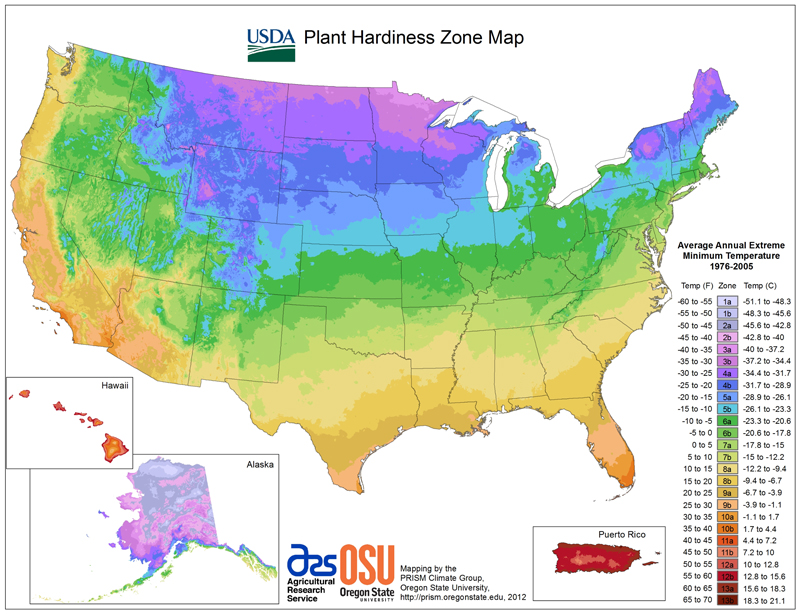
• Then an updated map was produced in 2012. It included more reporting stations, and it took into account only more recent years. Hardiness Zones in Texas were shifted – in many cases north by several counties.
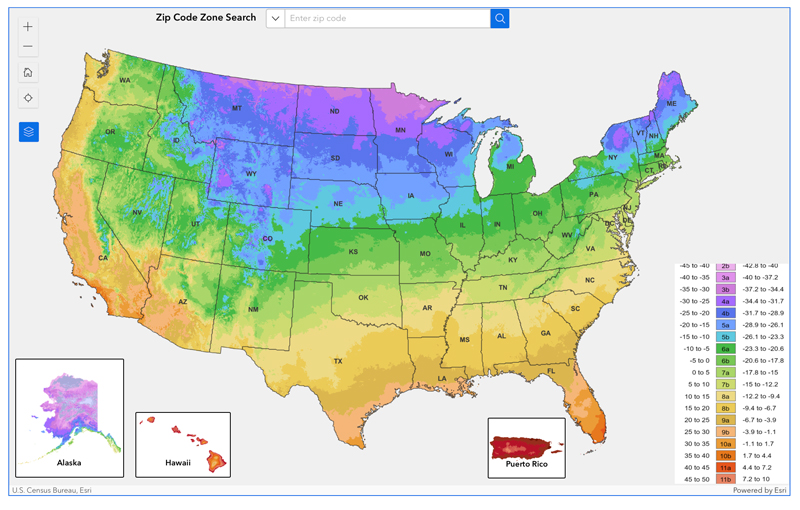
• The newest map from 2023, introduced just a couple of months ago, has still more reporting stations. It includes temperatures of only the past 30 years. Hardiness Zones have been moved still farther north. What that suggests is that plants we might consider too tender to grow in our part of Texas ought to be able to withstand average winters for us. Says Neil: “That has not proven to be the case in recent winters.” Read on.
• BUT here are my concerns – February 2021 was horribly cold. Surely you remember it! And then, this past week was 10-20 degrees colder than this 2023 map predicts for many parts of the state. And there have been several other times.
• Landscapes cost big bucks, and as those plants grow they become worth still more. We can’t afford to watch them freeze and die because we bought plants that weren’t really winter hardy for our area. That negates the value of the map in the first place.
Here’s how you can test it…
The 2023 map is interactive. Click on this link and open the map on a computer. Zoom in until you can navigate comfortably.
You can hover your cursor over an area, and it will tell you the expected low temperature and the Hardiness Zone for that precise location. You also have the option to enter a Zip Code to test the map. Test it on your city. See if it wasn’t colder than the map predicts for your town.
Remember that each 10-degree disparity represents one Hardiness Zone. That’s really significant when it comes to buying shade trees and landscape shrubs – as we found out painfully in 2021.
My suggestion from all this…
Go ahead and use the Hardiness Zone map if you wish, but buy woody plants rated as winter hardy one Zone colder than where the map shows you to be. If it shows you to be in Zone 8, buy plants for Zone 7 or colder. If it shows you to be in Zone 9, buy plants for Zone 8, Zone 7 and colder, etc.
Noodle on it a little. Don’t make it too confusing. The map really does represent a lot of hard work by smart many people over a long period of time. It just needs some manual tweaking. And you may have to be the chief tweaker.