Hardiness Zone Map needs revision – again
(You may have seen me write about this in the Fort Worth Star Telegram last weekend. You may have heard me talk about it on the radio last weekend. I need to tell you here as well. This is a big deal.)
There’s no better time to bring this up than right now, while the memories of the late January cold are still fresh in your mind.
I want to explain the origin and purpose of the United States Department of Agriculture’s Plant Hardiness Zone Map and how it has evolved over the years.
• Farmers, ranchers, landscapers, nursery growers, and others working in agriculture needed a way of predicting how cold each winter might be in each part of America.
• County-by-county, data was collected over a many-year average as to the coldest temperature each county encountered each winter.
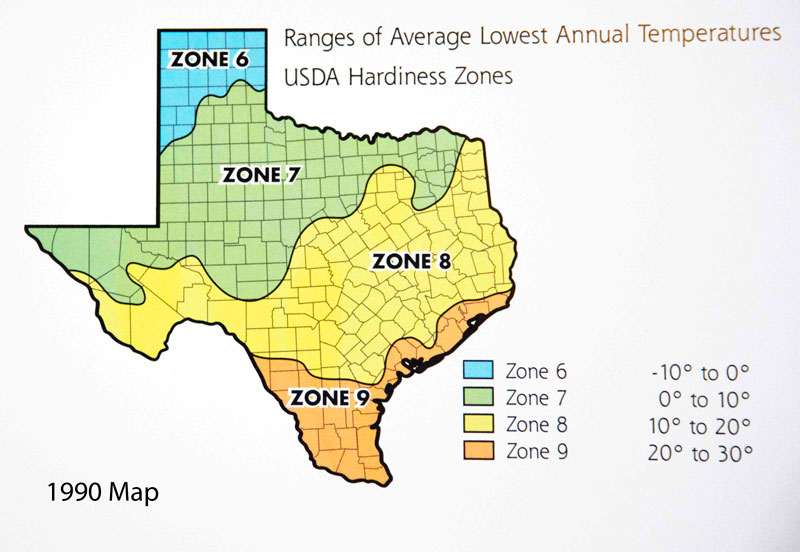
• The country was divided by 10-degree increments into Zones of winter low temperatures and a map was drawn and introduced as Misc. Publication No. 814 of the USDA (1960).
• The Zones that fell in Texas ranged from Zone 6 (0 to -10F) in the northern Panhandle to Zone 10 (30 to 40F) in the Rio Grande Valley.
• Subsequently, the Zones were broken down into more precise sections with 5-degree increments. The “a” section would be the colder, more northern portion, while the “b” portion would be warmer – to the south.
• The map was updated in 1990. That was good because it allowed another 30 years of data to make things more precise. The Zones remained pretty much as they had been.
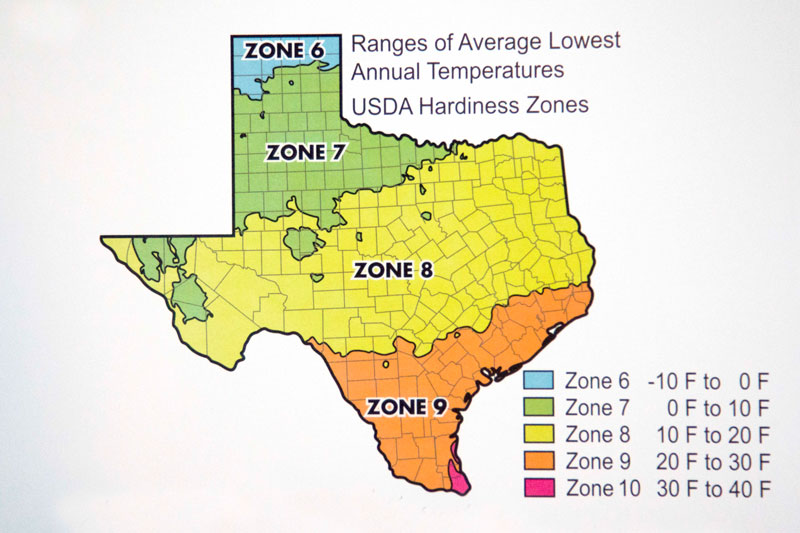
• However, another update came along in 2012. It took into consideration a decade of relatively “warm” winters in the early part of this century, and that skewed the numbers so much that it shifted Texas’ Zones several counties to the north.
• Some gardeners were not impacted. The map still showed they should be choosing plants from the same lists – hardy to the Zone they had been using before.
• However, many of us discovered that plants we knew to be tender in our parts of Texas were suddenly (theoretically) supposed to be hardy to our part of Texas. Zone 8, as example, which stopped south of the Metroplex in the 1990 map, now extended all the way north to the Red River.
• The further refinement, the 2023 Hardiness Zone map, still shows that same northward shift of the Zones, and I just don’t think that’s good.
• Look back at the temperatures your area encountered last week. Were you colder than the 2023 map predicts? If so, then you’d better not trust the Hardiness Zone it predicts for your city.
• In that case, choose plants from one Hardiness Zone colder. If the map shows you to be in Zone 8, choose only Zone 7 or colder plants. If you want to try a Zone 8 plant, use it sparingly, and plant it where you can protect it.
• Last week certainly wasn’t the best example of this serious error. February 2021 was much worse. Temperatures in most parts of Texas were 10 to 15 degrees colder back then than they were two weeks ago. That’s why we lost so many plants.
Other things to think about…
These maps are only taking the predicted low temperature into consideration. There are many other factors involved. Things like wind, exposure to sun, plant hydration, plant hardening, time in the winter dormant cycle (2021 caught plants gearing up to start growing), and duration of the exposure to that cold.